Quality Improvement
Overview of the Quality Improvement Journey
The quality improvement journey shows the stages of an improvement initiative or project. Key stages are illustrated in this video.
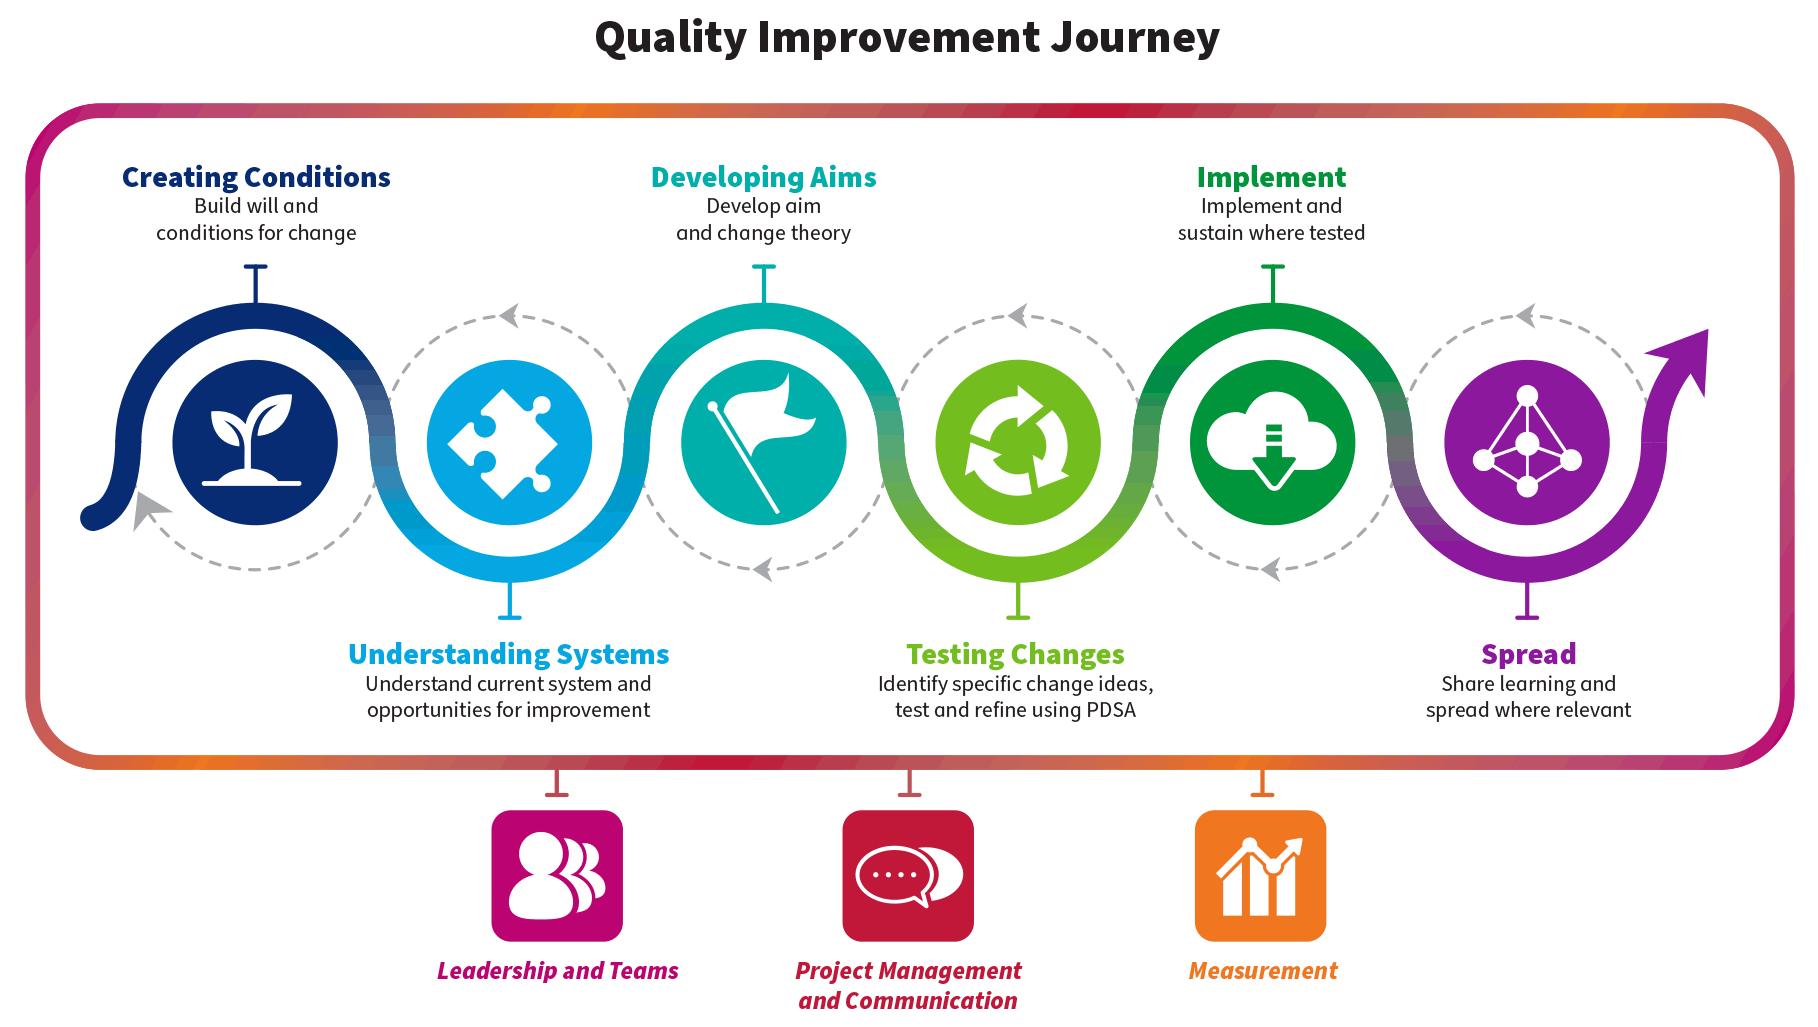
Image copyright: NHS Education for Scotland
For more information Quality Improvement please visit the Quality Improvement Zone section of the Turas Learn website.
The Model for Improvement

The Model for Improvement (MfI) provides a process for you to work through the stages of the improvement journey which supports rigour and consistency. The MfI can be a very powerful tool to allow you to make changes that will lead to better outcomes for patients. It provides a structure which supports team and professional development, innovation and learning; thus supporting a culture of continuous improvement in the quality of care provided.
The model consists of 2 parts. The first part is the “thinking part”. This contains three questions which assist us to define what we want to achieve, what ideas we think will help us achieve this, and what we need to measure to help us understand if change is an improvement. The second part is the “doing part”. This involves using the PDSA (Plan Do Study Act) cycle outlining the steps for testing the change ideas. The cyclical nature allows you to build knowledge and learning in order to refine and improve changes, providing a mechanism for continuous improvement. The methodology used in MfI allows teams to:
- Be clear about what they want to achieve
- Establish a feedback mechanism
- Identify the right changes
Step One: creating condition for change
Building enthusiasm for your project

Running quality improvement takes time, energy and enthusiasm and creating the conditions for change is fundamental to the success of the work. This should be done at the beginning of an improvement project. Consideration of core stakeholders is important at this stage, so include staff, families and other key groups of people who will be affected by the change and /or can influence the change.
This early collaboration will help to optimise ownership and engagement of the improvement. It will also help to establish a sense of shared purpose and values. At this stage you may want to consider:
- Involving your senior team to ensure organisational alignment. This raises the profile of your QI work and provides ongoing momentum for your project
- Creating a common goal/vision and share it widely
- Who needs to be included in the project team. Ideally this should include staff who will be implementing the change ideas, subject experts, families and someone with QI knowledge
Top Tips
Winning hearts and minds. A clear understanding of the issue and how it affects people and care provided can really support momentum for the project and ultimately successful change to happen. Some of the project charter questions can be useful to help you map this out and create conditions from the outset .
Project Charter
The project charter questions are useful to help you map this out and create conditions from the outset . For a blank project charter, please use the following Word-based template (Please note: this file is only accessible to NHS staff). We have provided an example of a completed project charter in Microsoft Word format.
This lays out the scope, purpose and rationale for the project as well as who will be involved. It is a crucial ingredient for planning and documenting the essential components of the project and should be used across the project life cycle.
Step two: understanding your system

- What is your starting position?
- Where are the gaps?
- How do you start to understand the problem better?
When you are working in the system, e.g. the unit itself or a particular care pathway, it is often hard to see all the items, let alone understand them all. You may only see it from your viewpoint. QI is a set of tools and techniques that help us understand better the systems we work in, including the processes and inter-related factors at play, to allow us to strengthen the way we work.
Taking the time to understand your system using QI tools to dig deeper will help you appreciate root problems and gaps, your starting position as well as where improvement opportunities may lie.
To gain understanding of the system or the part of system you want to focus on, it is important to involve the people closest to it. This will include those doing the work i.e. staff and those interacting and receiving a service i.e. families. By involving them, we can really appreciate their experiences and what matters to them.
Top tips
Identify what matters the most by engaging staff and families using QI tools to understand problems, gaps and strengths to inform your improvement effort from a 'whole system' perspective at the onset of the improvement journey. You can start with one or two families or use focus groups.
Revisit the project charter questions once you understand the problem better and involve key influencers in the discussion such as you senior leadership team. For more information on understanding your system, please visit the Understanding systems section of the Turas Learn website.
Tools to help you understand your system may include the Cause and Effect Analysis, which is used to explore and record likely causes of problems.
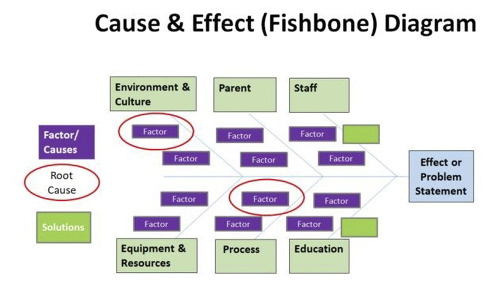
Find out more: how to use a cause and effect diagram or to download a blank template.
5 Why’s: Helping teams understand underlying quality issues, problems and improvement focus.
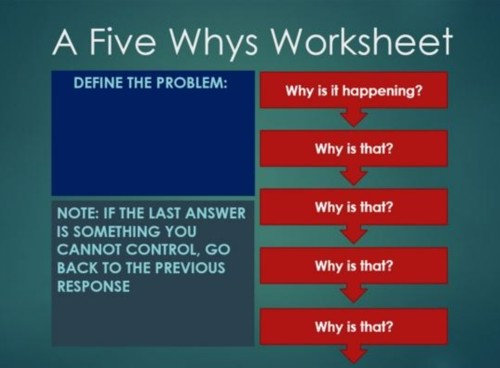
What is it and how can it help me?
By repeatedly asking the question 'why?' (use five as a rule of thumb), you can peel away the layers of an issue, just like the layers of an onion, which can lead you to the root cause of a problem. The reason for a problem can often lead into another question; you may need to ask the question fewer or more than five times before you get to the origin of a problem.
The real key is to avoid assumptions and logic traps and encourage the team to keep drilling down to the real root cause. Visit the Turas Learn to find out more about the five whys.
Improving exclusive breastfeeding rates in NHS Highland with introducing ante natal colostrum harvesting.
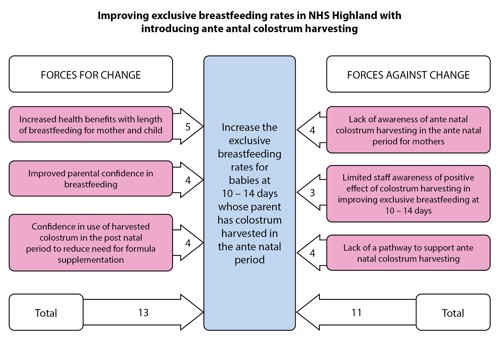
Please visit the Turas Learn website to find out more about Forcefield Analysis.
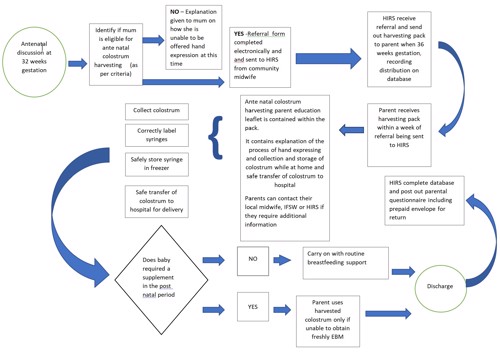
Process map for colostrum harvesting
User experience (including surveys): method to gather information from the perspective of a person who interacts with and/or receives something from a service. Please visit the Turas Learn website to find out more about user experience (including surveys).
A questionnaire was distributed to mothers who have expressed colostrum in the ante natal period, to gain gain insight and information on how users found the colostrum harvesting service.
Pareto Charts
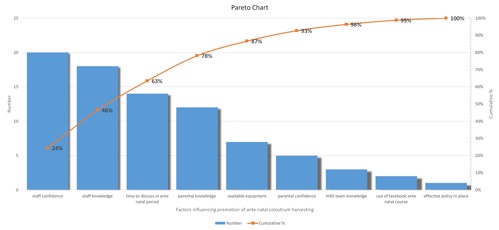
Pareto charts help teams identify and focus on areas of improvement with the biggest impact.
Please visit the Turas Learn website for more information about Pareto charts and to download a blank template.
Baseline Data
Baseline data allows us to understand our starting position and how much improvement we want to make.
Step three: developing aims
What are you hoping to achieve in your Improvement project?

In QI a clear aim, written as a SMART aim (Specific, Measurable, Attainable, Relevant and Time based), is set and specifies how much and by when.
Developing your aim and change theory is an exciting and crucial step in the improvement journey which naturally leads on from the learning generated through the use of QI tools. Teams undertaking improvement projects need to be able to articulate exactly what they want to improve, including what ‘better’ looks like. An aim statement should be concise, be ambitious and stretching but realistic enough to be achievable. Think of it as a brief description which should clearly communicate what you intend to accomplish:
- What you are trying to achieve
- How much you want to achieve
- When you want to achieve it by
- Who will benefit from it
An example would be:
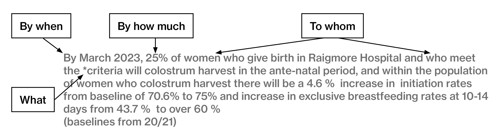
An operational definition is used in an aim statement to avoid confusion and maintain clarity. In the above example the terms *meet the criteria is operationally defined in the ante natal colostrum harvesting policy detailed below.
* Any expectant mother in NHS Highland could potentially express her breast milk starting from 36 to 37 weeks gestation, but it is particularly useful if the baby is at an increased risk of having a low blood sugar in the first few hours after birth. Antenatal expressing is not recommended in the following:
- Women known to have cervical incompetence
- Women who have a cervical suture in situ
- Women who have had threatened or actual premature labour
- Women who have a multiple pregnancy
- Women who have polyhydramnios
- Women who have had contractions, vaginal bleeding or premature rupture of membranes in current pregnancy.
Top Tips
Gather baseline data before defining your improvement aim so you can understand your starting position and how much you want to improve. This will provide clarity on the extent of the improvement relative to where you are now and where you want to be.
The team should consider if achieving the aim is within their scope of influence and /or if a wider group of stakeholder need to be involved.
Consider the scope of the aim. If it is too big, it may be difficult to extrapolate learning and will impact on the success of the project. Consider if it is necessary to narrow the scope of the project at this stage.
- Discuss if everyone is clear on key terms used in the aim, if not use operational definitions.
- The team should consider the outcome relative to the aim statement and if this can be measured.
- Why is change theory necessary?
An improvement aim cannot stand on its own. It should be supported by an agreed theory about what needs to change to achieve it. Your theory of change should be based on your current understanding of how things work and can be updated as you learn more. It should consider any available research evidence as well as the knowledge and ideas of the people experiencing the system.
A driver diagram is a useful QI tool which can help you develop and communicate your change theory including how an improvement goal will be achieved.
It is used to help plan improvement project activities and ensure team engagement. See below for an example of a completed driver diagram
This Driver Diagram Template already has primary and secondary drivers populated for you. You can add your own change ideas to this for your local unit. There may also be requirements or solutions particular to your unit relating to facilities, infrastructure, culture and environment which you may need to include as (secondary) drivers .
A completed example of a driver diagram has been provided in Microsoft PowerPoint format.
Step four: testing change ideas
"All improvement requires change but not every change results in improvement"

By generating change ideas and testing them before we implement we increase our chances of introducing changes that are effective in targeting quality issues that matter to families and staff. It allows us to generate understanding about what works and how. A test is taking a change idea and applying it to your situation.
The PDSA cycle is a reflective process which uses feedback and data to inform team learning about our change ideas. It allows the team to understand if what they predicted from the change did indeed happen and to what extent. In quality improvement we generate learning by starting small and building on the change idea through iterative PDSA testing. Ideally this should involve testing across a variety of conditions e.g. testing ideas across different groups/families
The PDSA Cycle
This lays out the scope, purpose, rationale for the project as well as who will be involved. It is a crucial ingredient for planning and documenting the essential components of the project and should be used across the project life cycle.
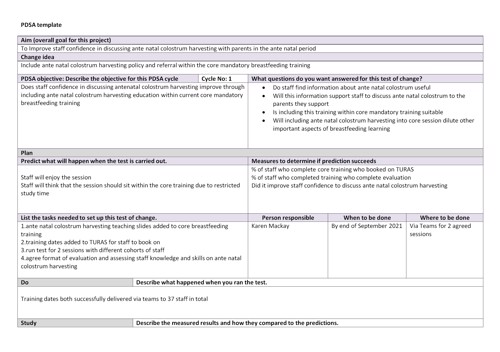
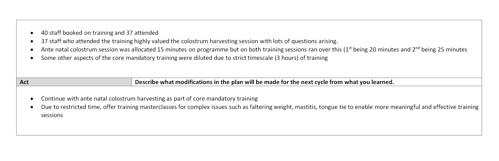
Please visit the Turas Learn website for more information about testing and PDSA with useful templates for your team to use.
An example of a completed PDSA record has been provided in Microsoft Word format.
Change Ideas
Change ideas are specific things you can test to see if they make a difference. A change idea is not just a general concept. For example, improve communication in the team is a concept whereas the introduction of a discussion about eligibility for kangaroo care on the ward round is a change idea.
Generating change ideas is central to your project success and your theory of change. Click here for some suggestions that might help you identify change ideas
It can be very easy to mix up change ideas with tasks to be done within the project. For example, collecting data is not a change in itself that will impact on your aim but an important task within the project. It may be useful to think about a task as something you 'just do' and a test as a reflective activity which you are ‘trying out’ and building learning and knowledge about.
An example of a colostrum harvesting prioritisation matrix has been provided in Microsoft Word format.
Top Tips
You can't do everything at once. You will not be able to test all change ideas at the same time so you may need to prioritise ideas to test. Use your driver diagram to help you prioritise as it may help the team consider and select a key primary driver and associated secondary drivers and in turn the change ideas aligned to this to support the aim being achieved. There will be multiple factors you will need to consider when prioritising your improvement effort and tools such as the Prioritisation Matrix can help.
Put in example below when you are ready for it – To Do **
When developing and identifying changes for improvement think about these from the perspective of the people affected by the change and what matters to them.
Measurement and Data
How will we know that a change is an improvement?
Data and measurement go hand in hand. Data for improvement needs to be collected and tracked as frequently as possible to support learning and build knowledge in order to understand if changes are leading to improvement and if so how much. The data can be quantitative and qualitative and can be supplemented by patient and staff stories and experiences.
There are 3 types of measures we use in improvement projects, Outcome, process and balancing measures:
- Outcome - This is directly linked to your aim. There is usually 1, possibly 2 outcome measures associated with your aim. There is often a tangible link between the outcome measure and the outcome for the people receiving care.
- Process measures - Your improvement project will likely involve changing or modifying different processes or systems to hopefully improve the quality issue you’ve identified. Process measures help you understand if the parts/steps are performing as planned and if so how reliably and consistently. This is important to help you understand if you are on track to achieve your aim and associated outcome measure(s).
- Balancing measures - These can help show whether unintended consequences have been introduced elsewhere in the system which can be positive or negative to the quality of care to the care group involved in your project or for the quality of care elsewhere in the unit. For every project you will need between 5-8 measures.
A measurement plan is a useful document that should describe the type of measure, its purpose and details of how it will be collected. This provides a helpful communication tool for everyone involved in the project.
Please visit the Turas Learn website for more information on measurement plans. Alternatively, a blank measurement plan has been provided in Microsoft Word for the Web format.
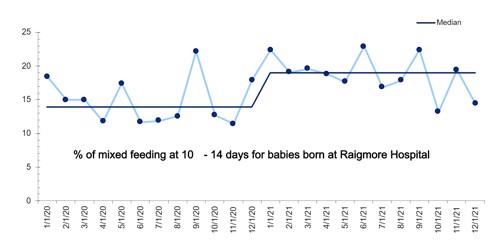
Tracking and Visually Displaying Data
A run chart is an easy and effective quality improvement tool. It allows you to look at data over time which is essential for learning from iterative testing. This allows you to understand the impact of your changes as you introduce them. Critically it shows you if your changes are resulting in sustained improvement and if so, by how much. Looking at data over time using run charts allows you to assess performance including consistency and reliability e.g. are all babies receiving the same standard of care, every day, every time. It also helps you to identify if there are any patterns in the data by applying run chart rules.
An example of a run chart for colostrum harvesting has been provided in Microsoft Word format.
The following video shows you how to create a run chart and apply these rules. For more information please visit the Turas Learn website.
Step five: implement

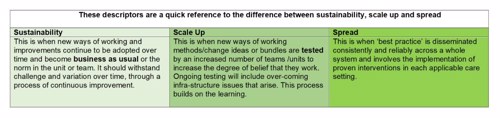
This involves making successful changes ‘business as usual’ and ensures that improvement is replicable and
sustainable.
Once testing has shown that a change is effective and leads to improvement you are ready to implement.
Implementation uses Plan, Do, Study, Act (PDSA) cycles to support making the change a routine/business as usual, an integral part of the system before spreading to other parts of the organisation. Please visit the Turas Learn website for useful film clips about implementation.
Top Tip
The key test of how embedded your change is: How confident are you that the change would persist even
if you/your leads were away for a month? See the following checklist to help you decide. This can be used
at either implementation or spread stages of your project.
Checklist
- Is there evidence to show that interventions/changes leads to improved outcomes?
- Are you seeing sustained improvement? (i.e. is it happening reliably and consistently for every mum who wishes to colostrum harvest
- Can you clearly describe the components of the change you have implemented?
- Can these be described in a way that is clearly understood by others?
- Does the change represent doing something differently?
- Can the changes be easily packaged and understood/tested by everyone on the unit?
- Do you have the relevant documentation to support the work undertaken? (i.e. driver diagram, measures, run charts, project plan)
- Are there any resource implications that need to be considered?
Step six: spread

What do we mean by spread?
Once you have implemented changes within your target population, you may be thinking about spreading out with that population. Spread is when improvement is adopted in other areas with modification. So once you have implemented changes successfully and achieved your aim with confidence and sustainability within your target population, you may be thinking of spreading this to a larger population of babies.
Please visit the Turas Learn website for more information on spread and you will find a range of resources to use in your project.